
An event needed an aftershow report spanning fifteen chapters, exhibition scale, business impact, media reach, strategic projects, and visitor and exhibitor feedback among them, without collapsing into a dense document readers would abandon halfway through or a flat PDF nobody actually opens.
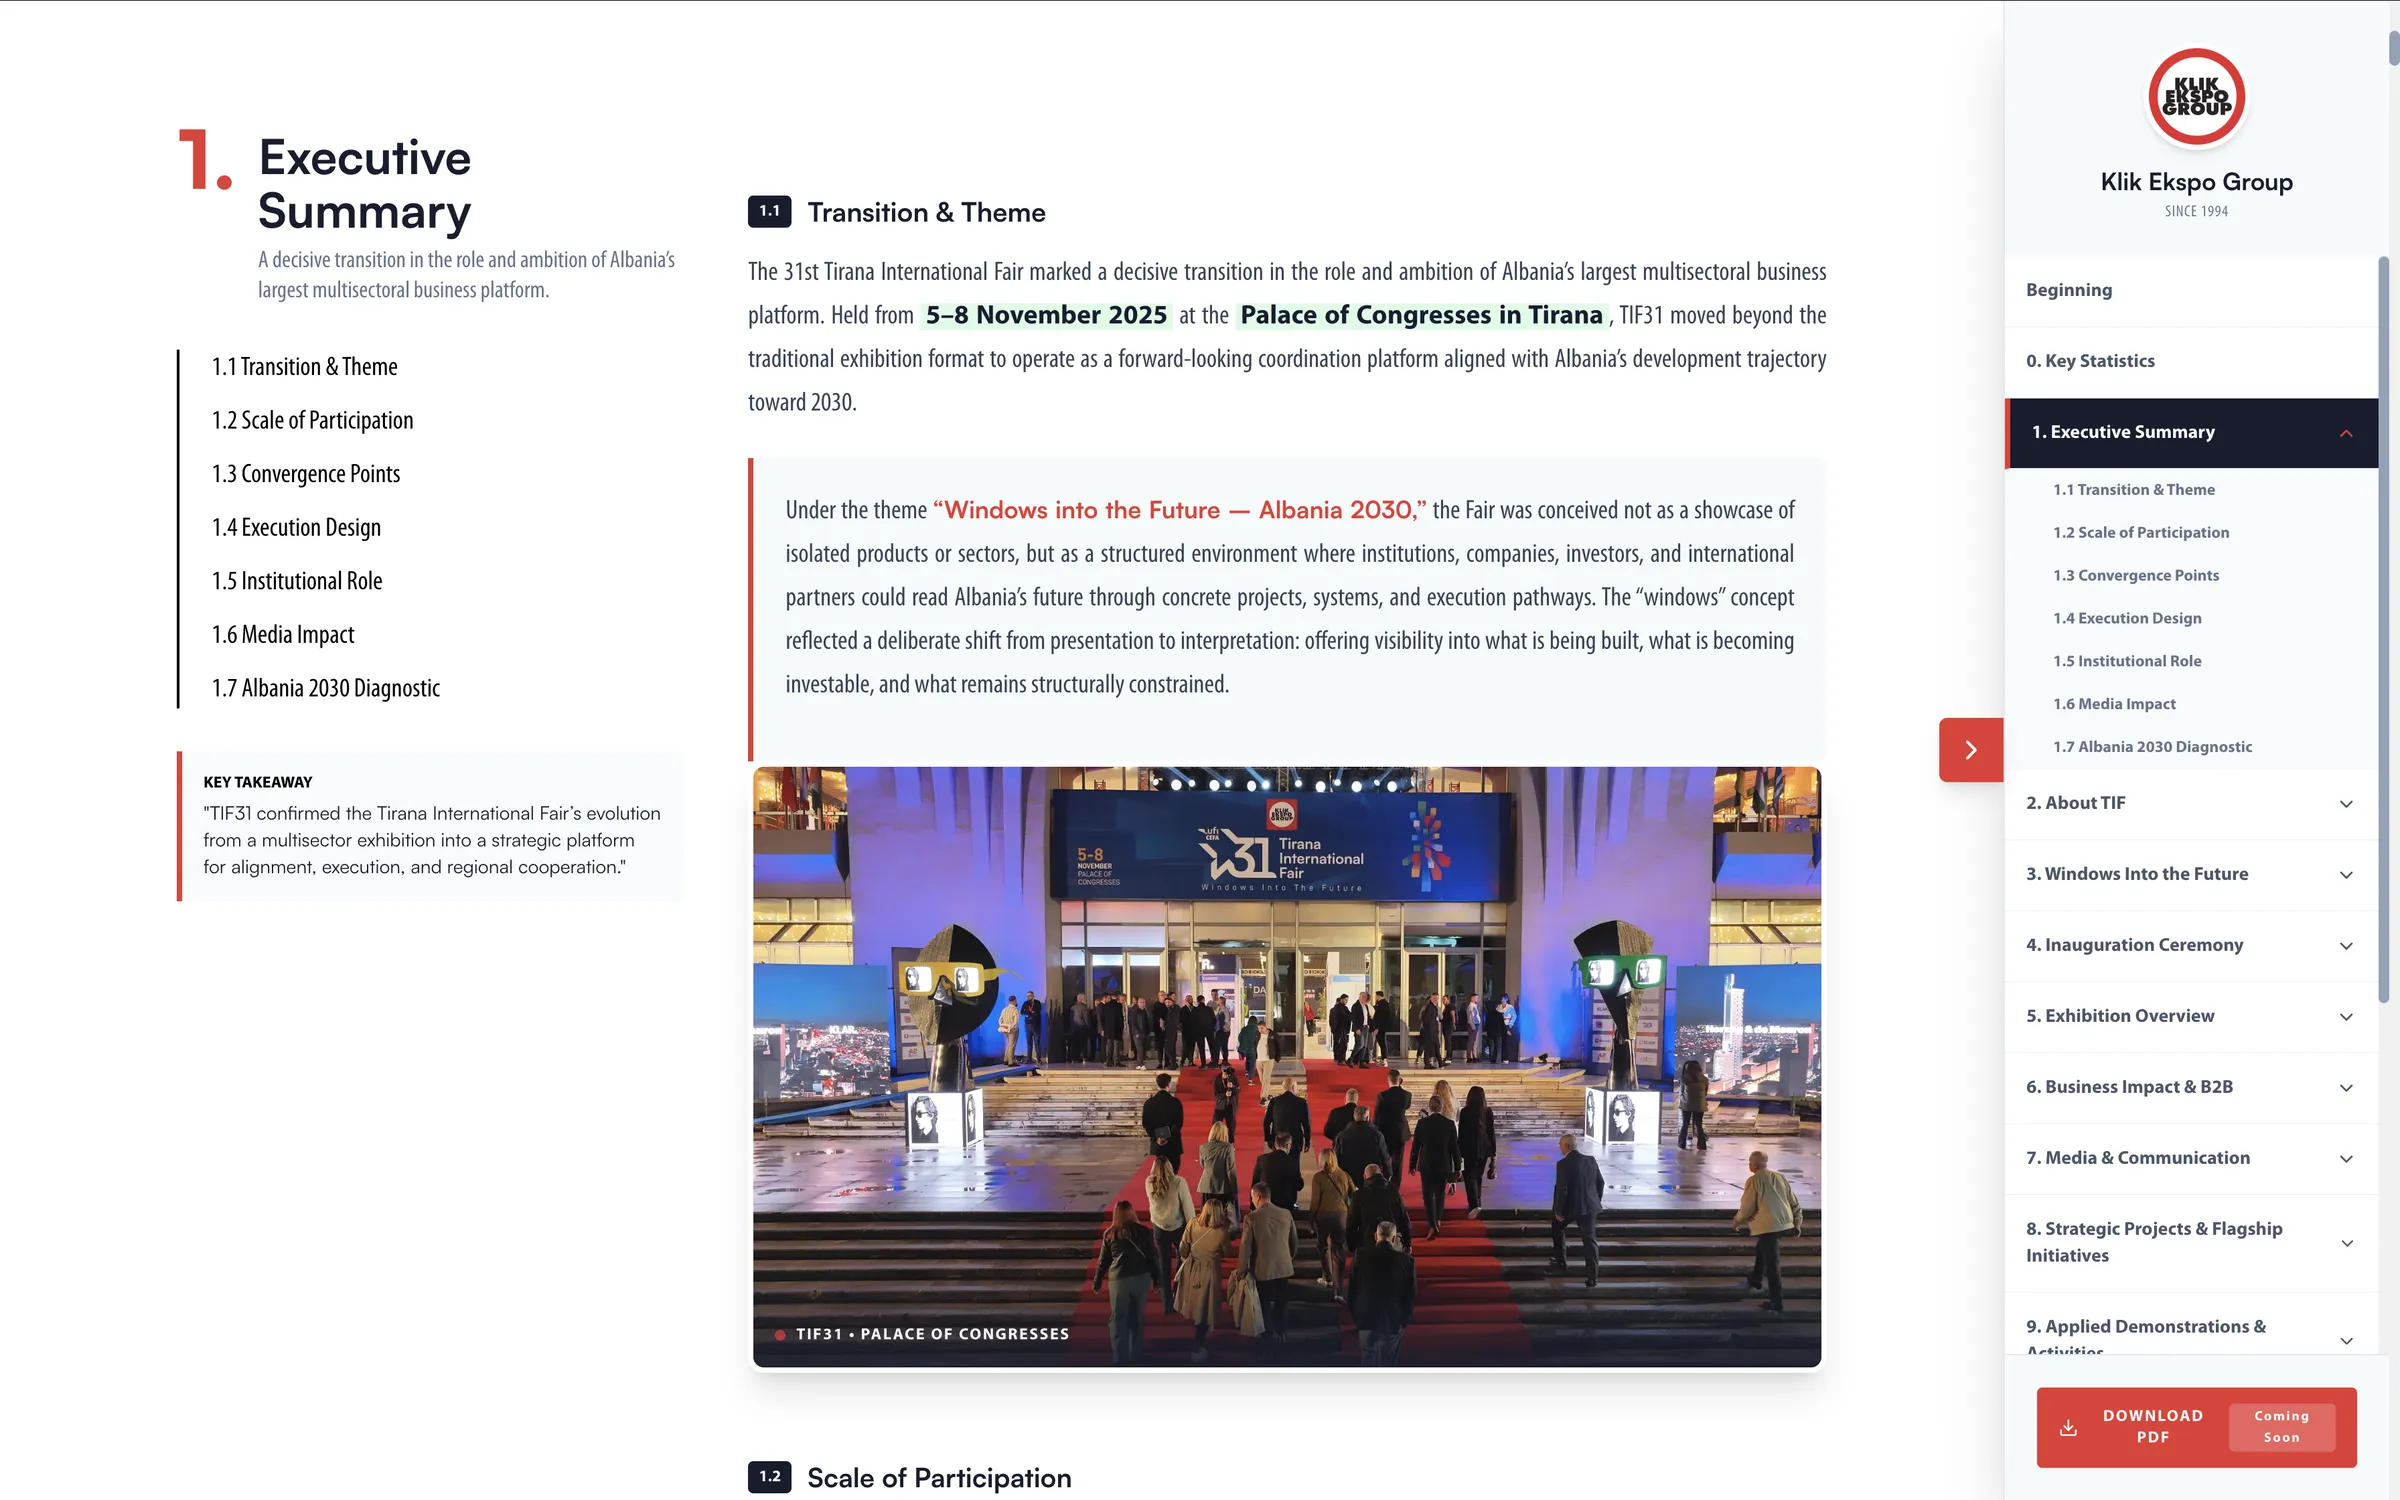

A branded cover sets the tone before a single number is read, then a persistent numbered sidebar carries readers through fifteen chapters.
Fifteen chapters sit under a single grouping, numbered zero through fifteen, with key statistics deliberately placed at position zero so headline numbers are always the first thing a reader can reach. A "Download PDF" action anchors the bottom of the sidebar for readers who'd rather take the report with them.
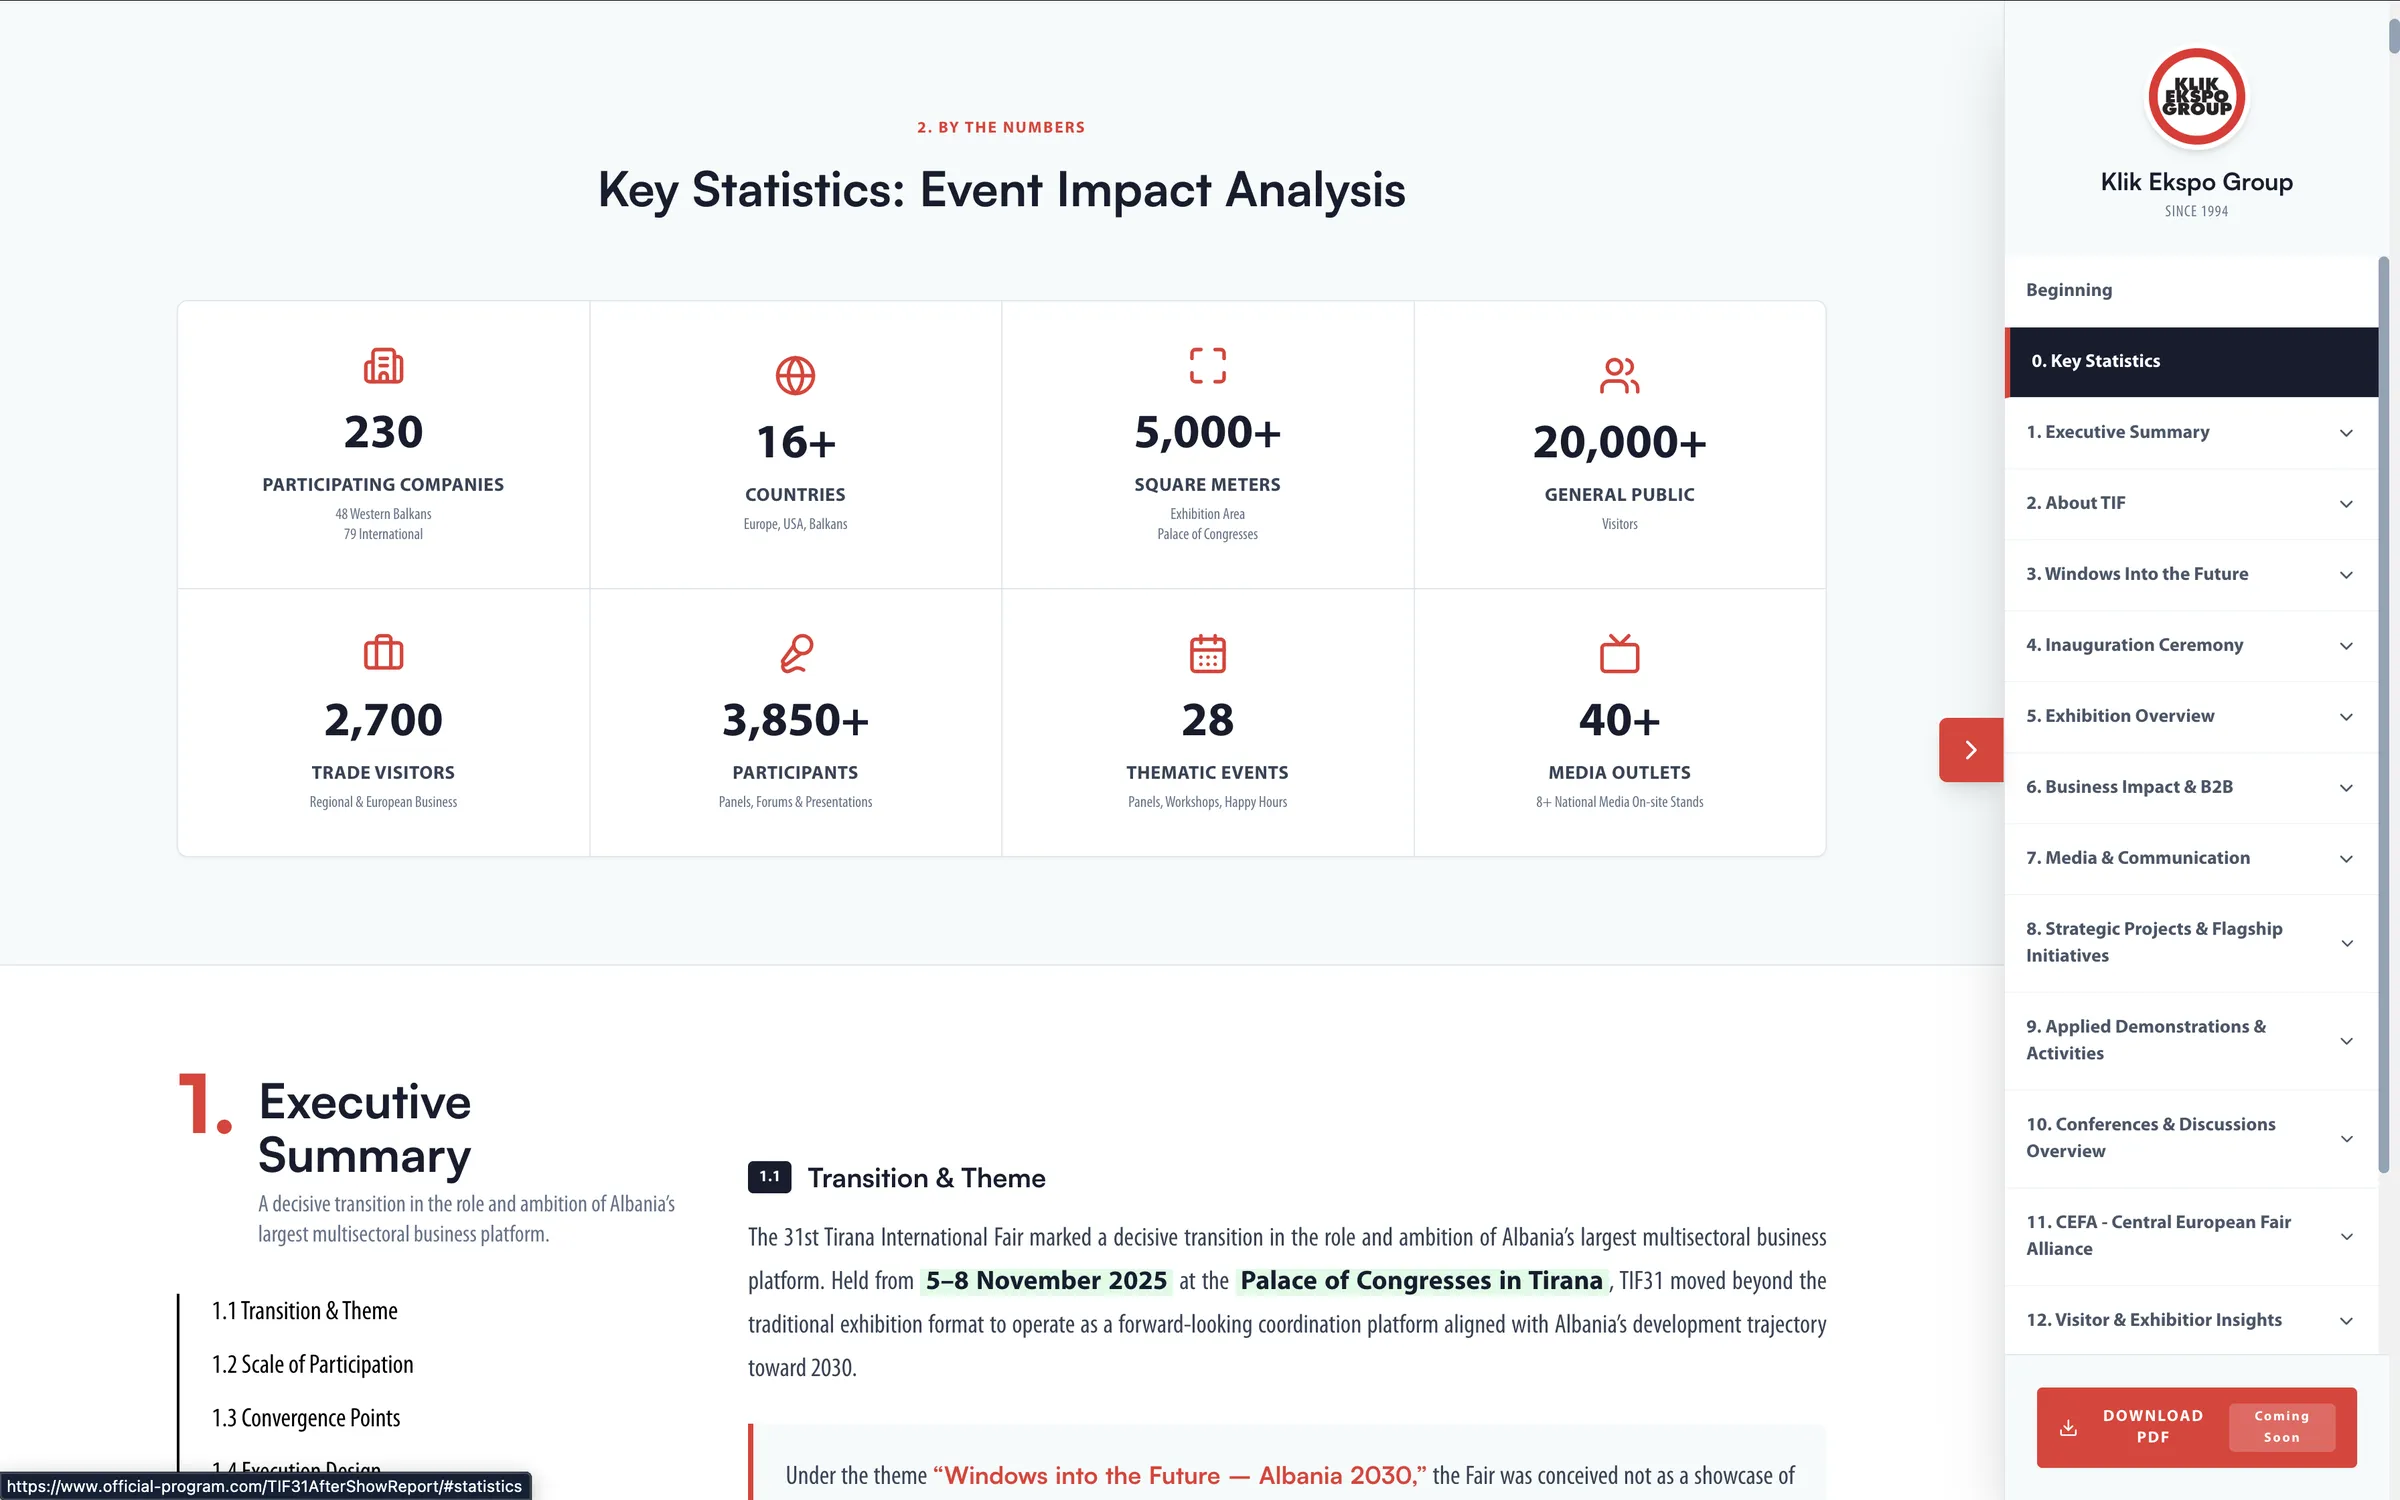
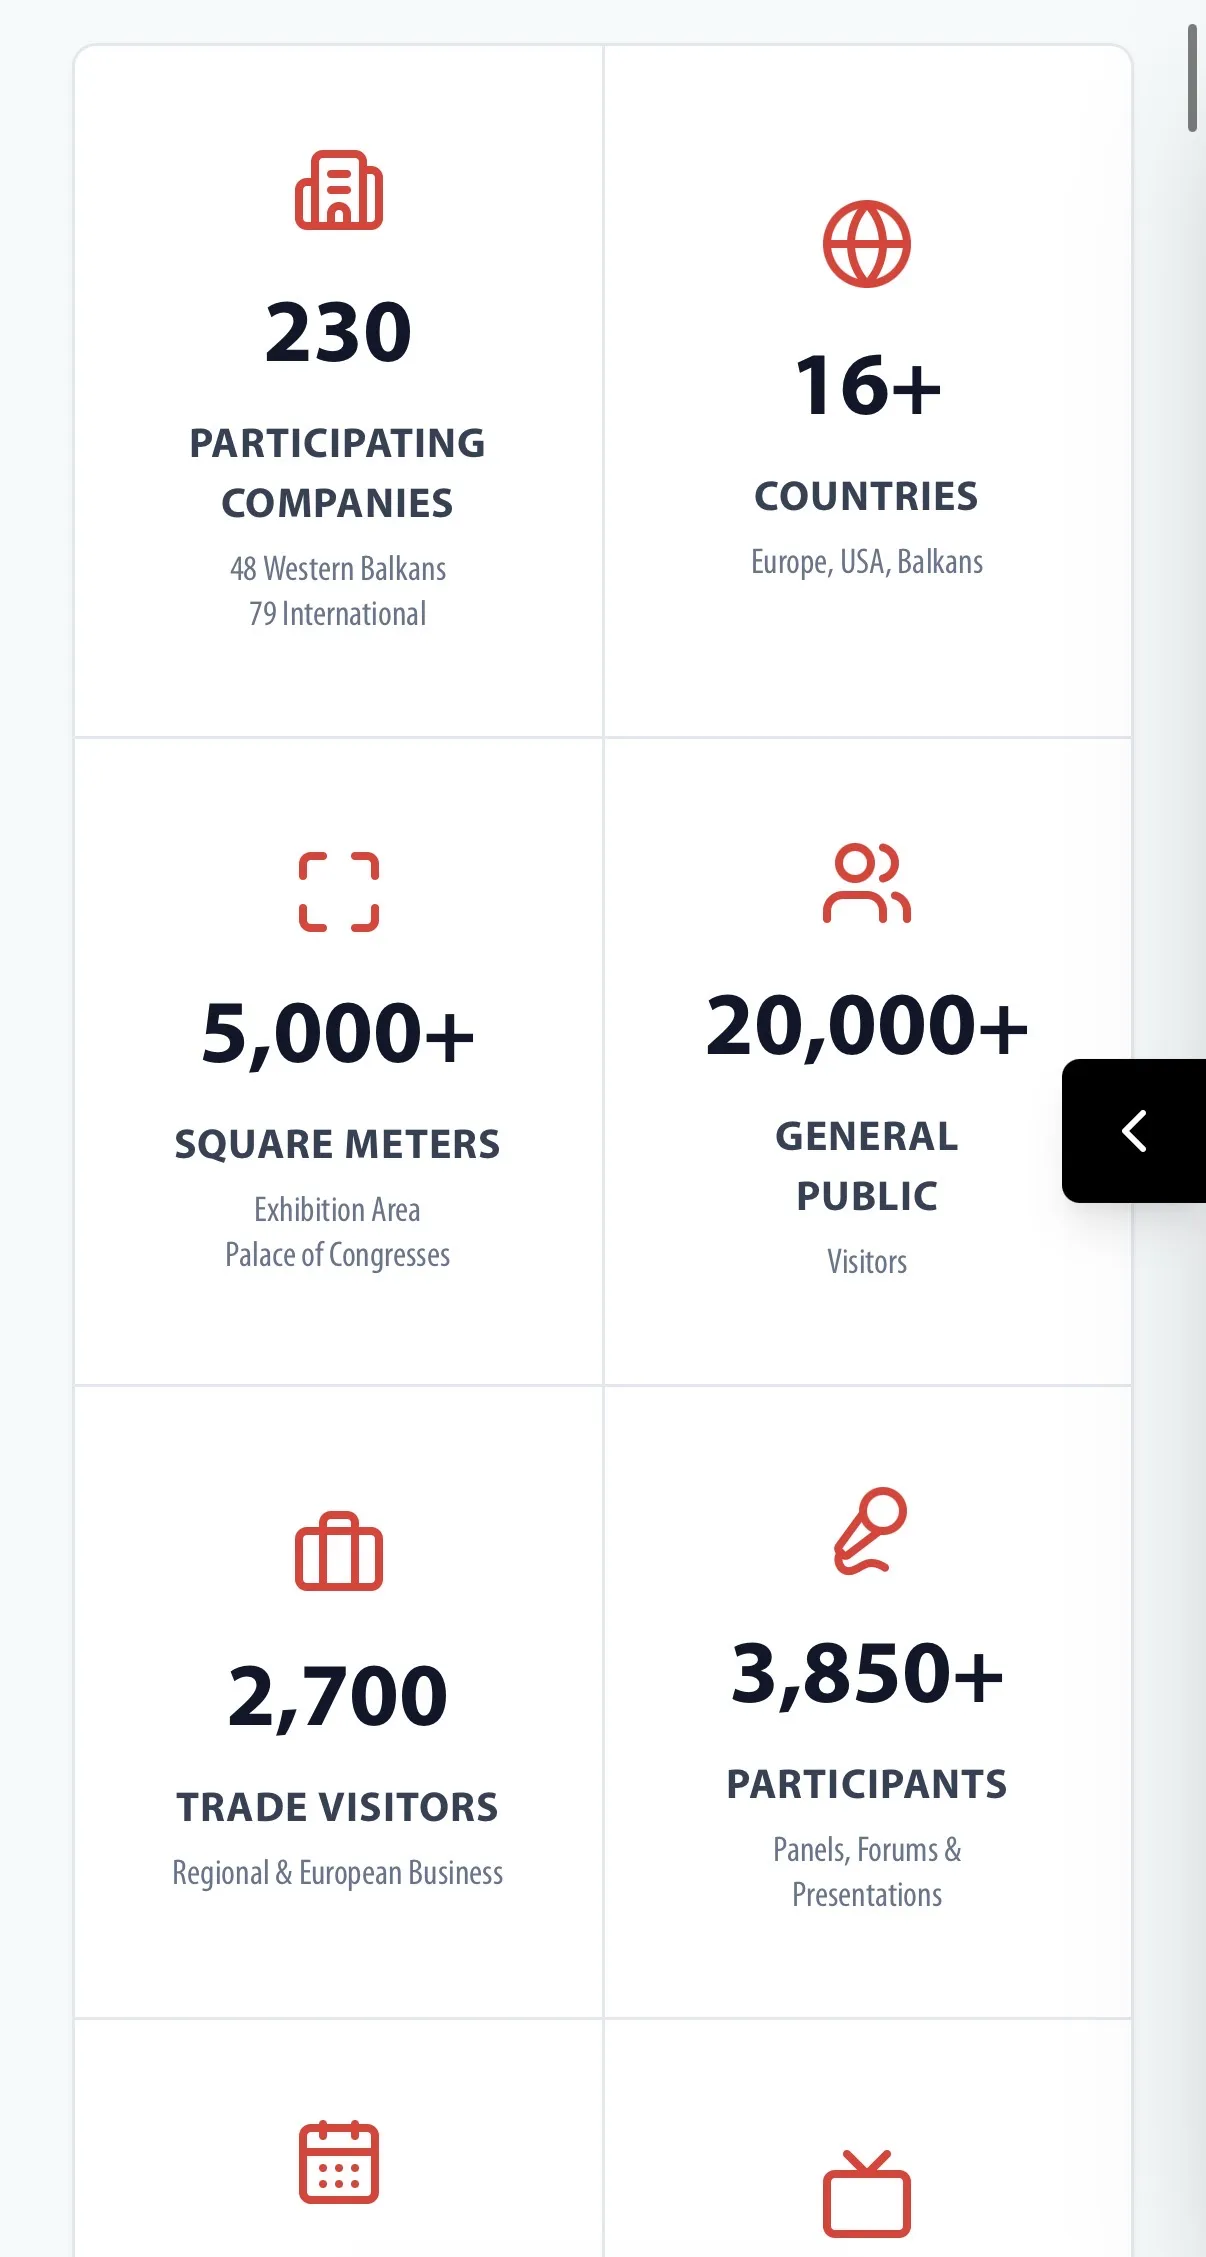
An eight metric grid, participating companies, countries, exhibition area, visitors, trade visitors, participants, thematic events, and media outlets, opens the report immediately after the cover, giving readers the full scale of the fair before asking them to read a single paragraph of narrative.
Highlighted quote blocks, "Key Takeaway" side cards, and icon labeled stat tiles repeat in the same form across every chapter.
One red accent marks the active sidebar chapter, section numbers, and key highlighted phrases throughout, while charts introduce their own restrained secondary palette only where a second dimension of data needs it.
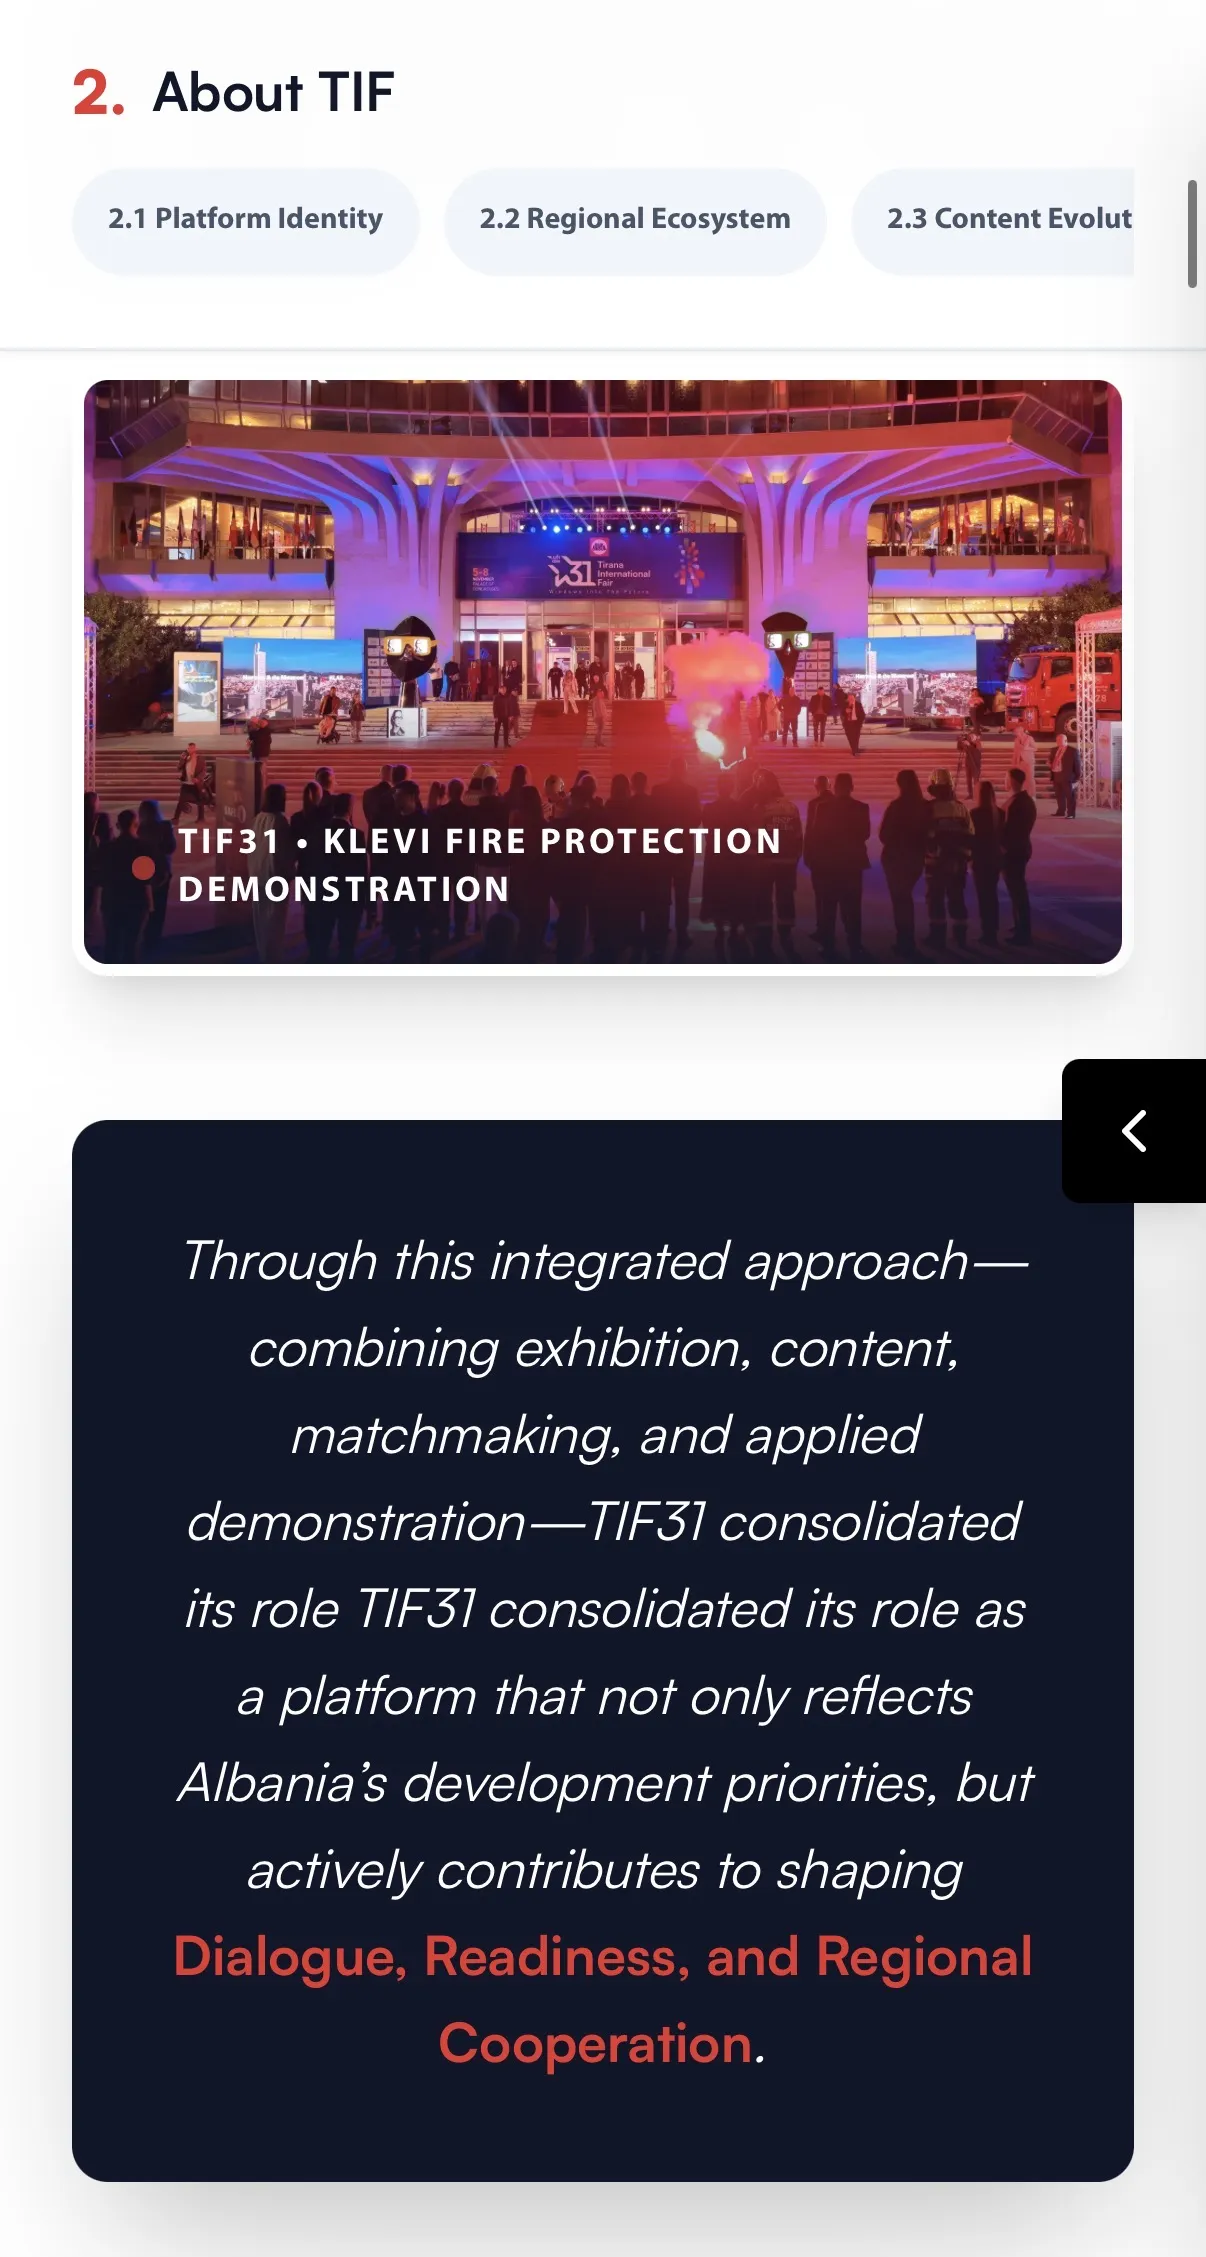
Each chapter pairs a short scannable intro column with a wider narrative column, mirroring the section image seen in the executive summary, so dense chapters still read at a comfortable pace.

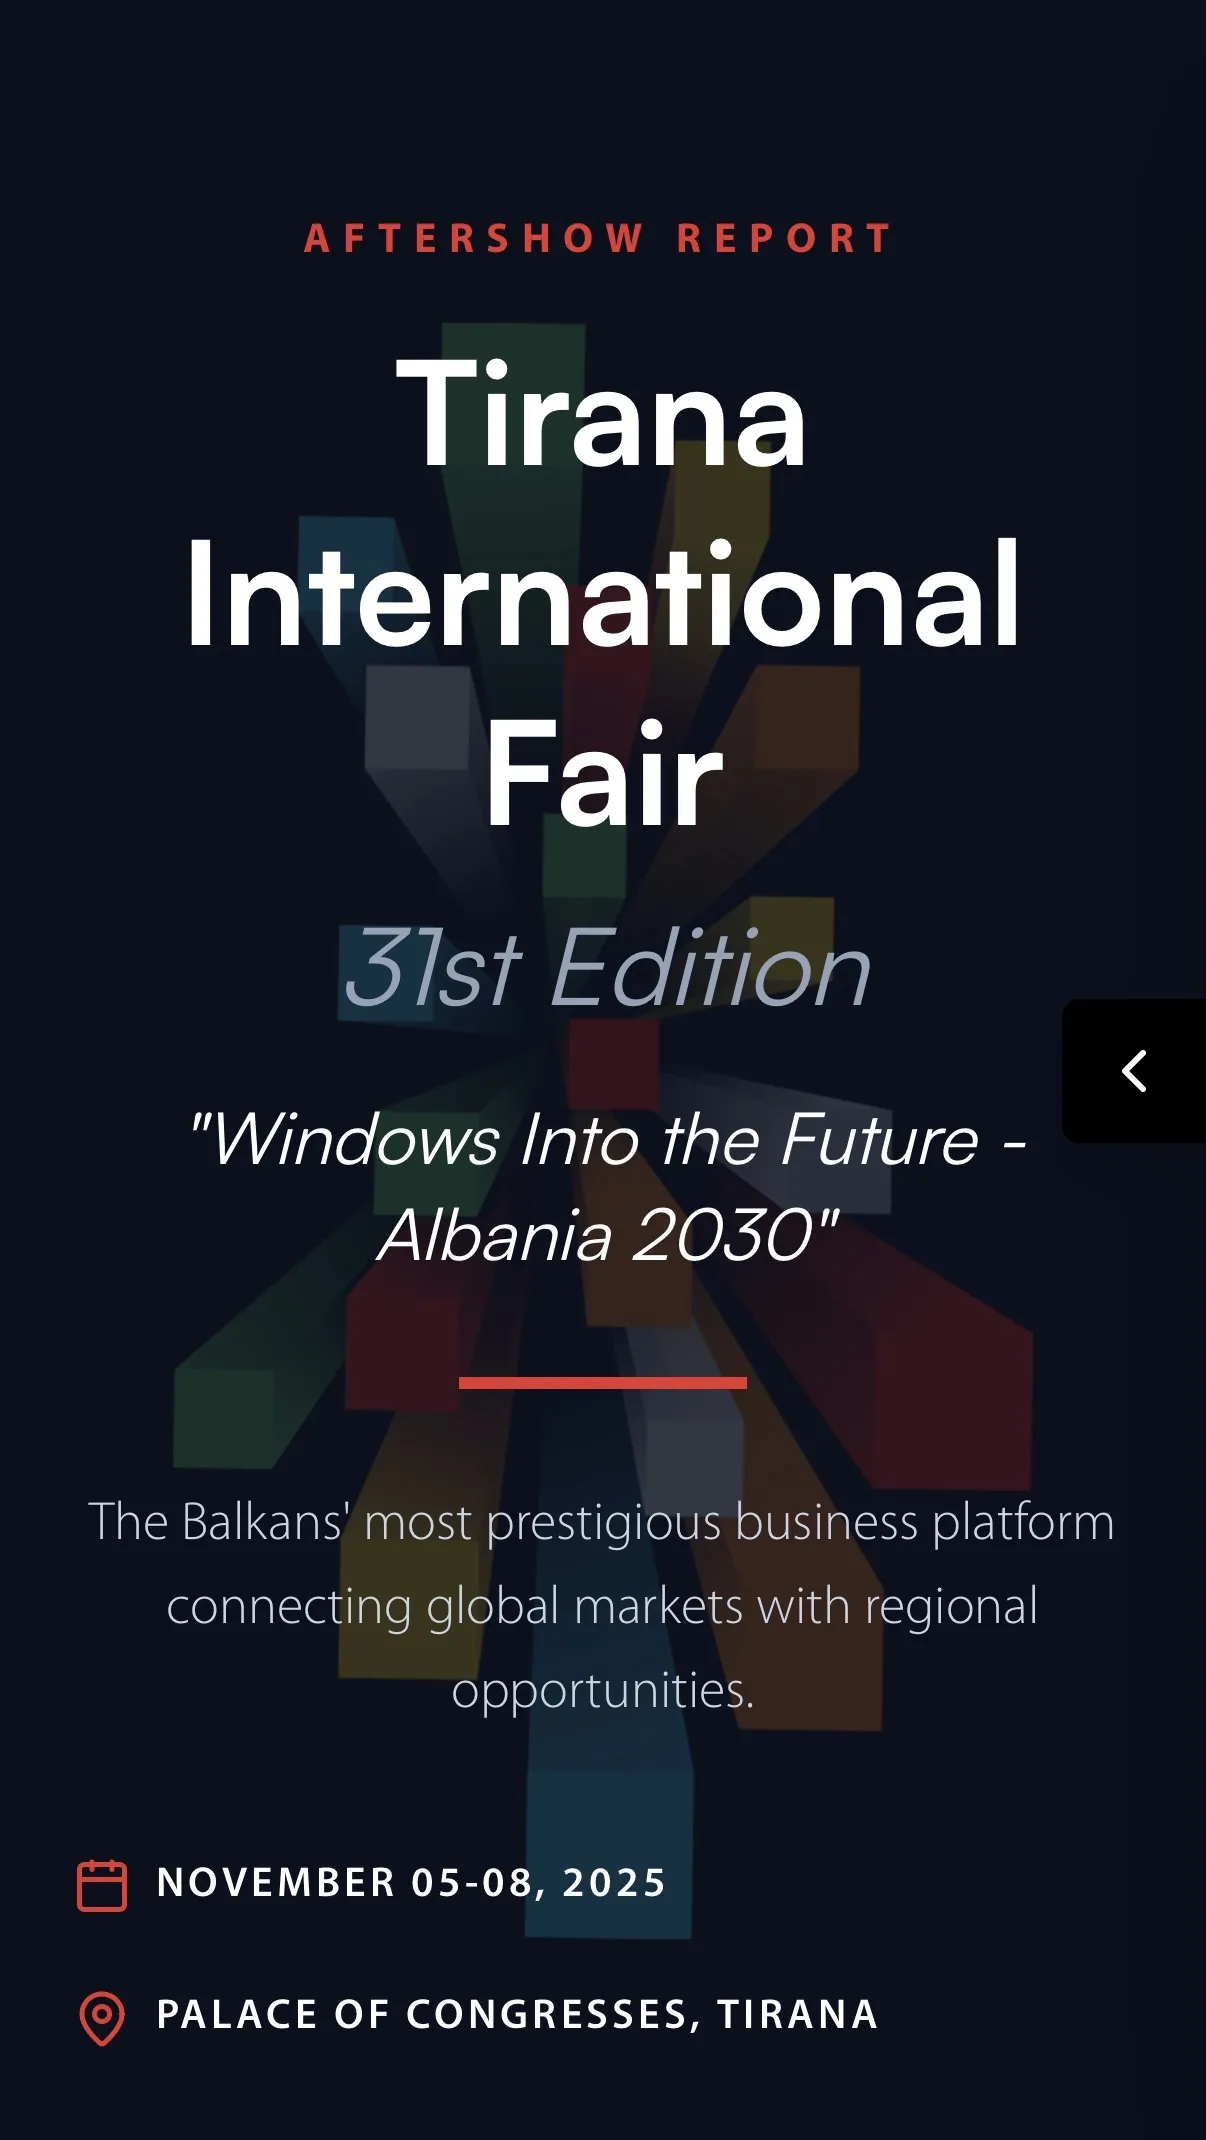
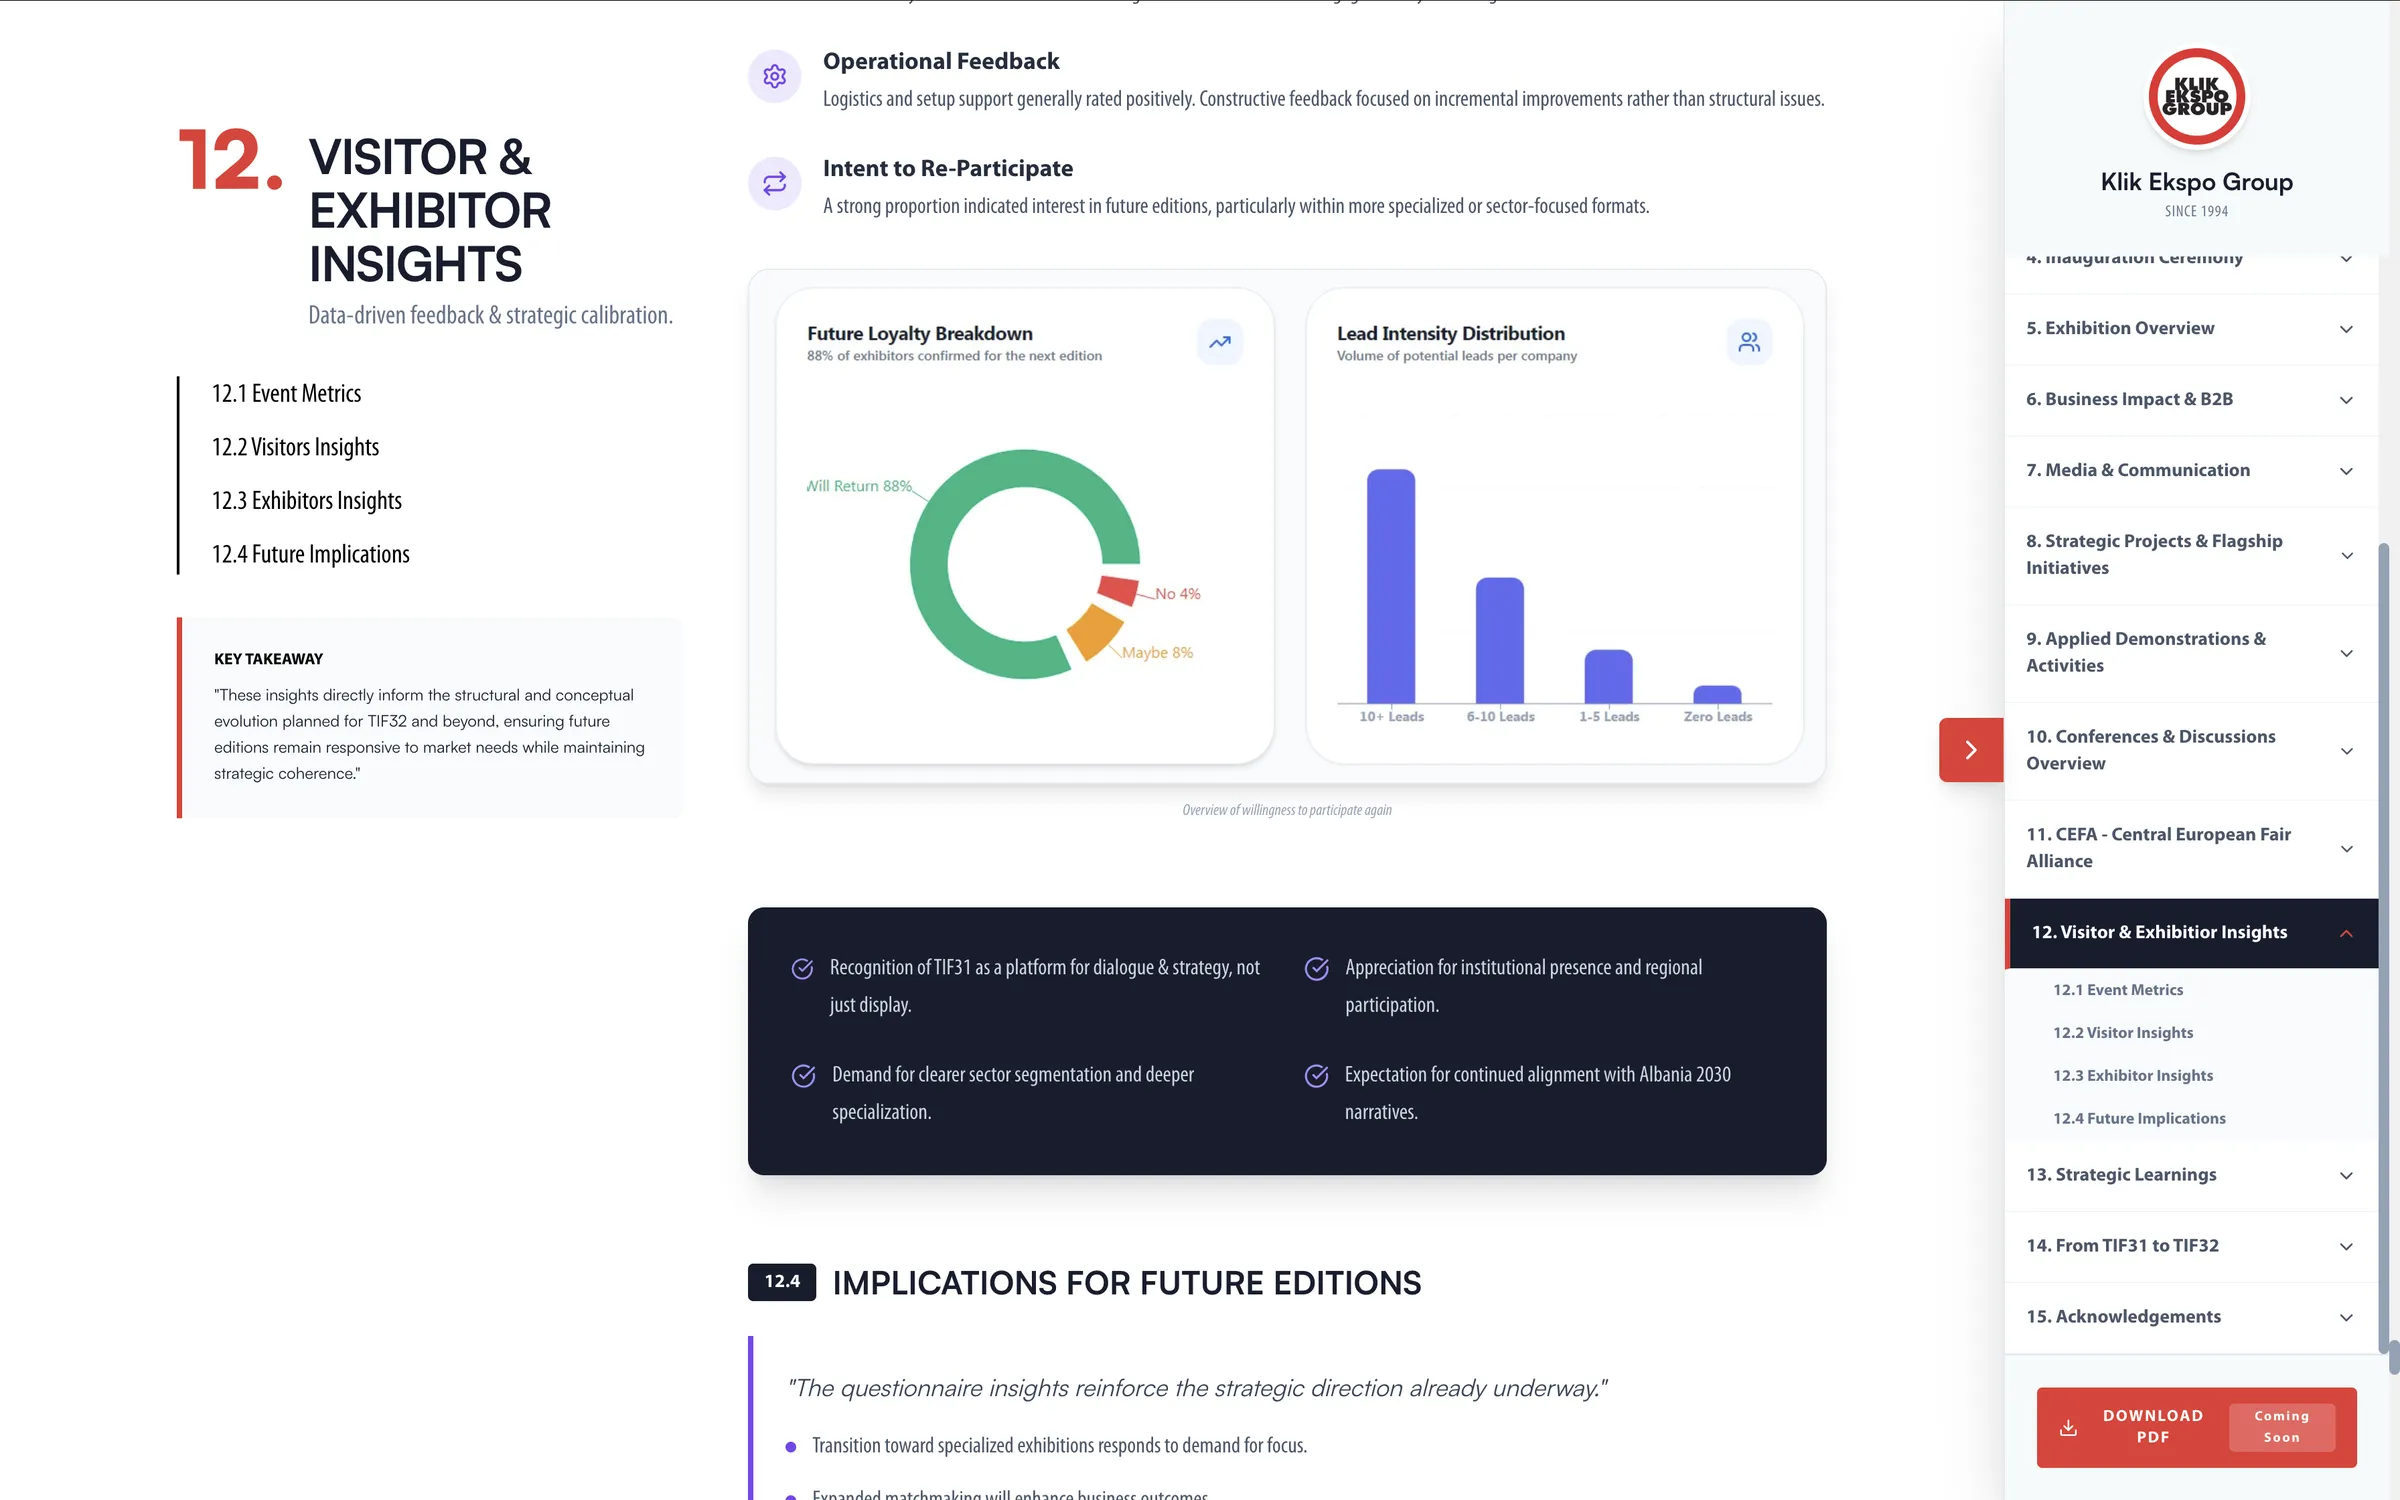
A branded cover, statistics placed ahead of narrative, a grouped and numbered sidebar, and a chart driven close turn fifteen chapters of aftershow data into a report readers can enter at any point and still understand the whole story.